System Monitor
A live performance dashboard showing how hard your Pi is working — CPU, memory, network, disk, and running processes, all updating in real time.
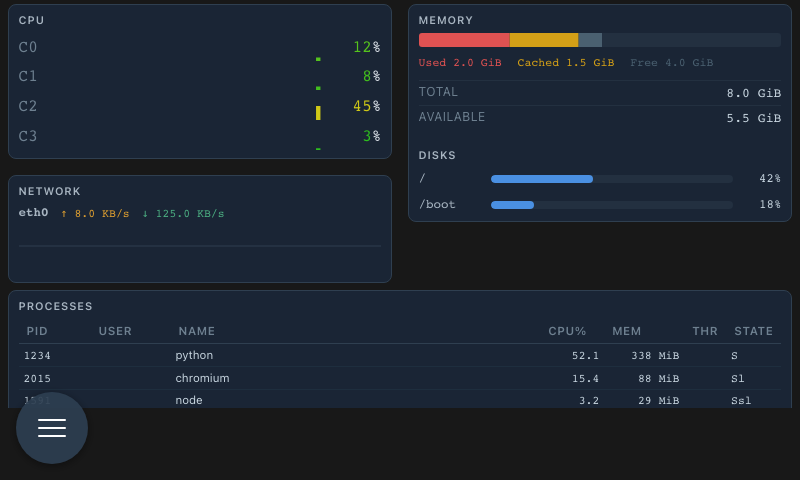
CPU
Each core is shown as its own row with:
- A bar chart history of recent CPU usage (bars shift green → amber → red as load increases)
- Current usage percentage
This makes it easy to spot whether load is spread across all cores or concentrated on one.
Memory
A segmented bar shows how RAM is divided across:
- Used — actively in use by programs
- Cached — recently used files held in memory for speed
- Buffers — I/O buffers
- Free — available immediately
Total memory and used/free amounts are shown below the bar.
Network
Each active network interface shows live transfer rates for:
- RX — data received (download)
- TX — data sent (upload)
Both values update every few seconds based on the actual bytes transferred.
Disk
Each mounted filesystem shows a usage bar with used vs. available space. The bar turns yellow when usage exceeds 75% and red above 90%.
Processes
A list of the top processes sorted by CPU usage, showing PID, name, CPU%, and memory usage. Refreshes automatically every few seconds.
Access
Open System Monitor from the main navigation or from the System Dashboard.